Case study
UDM Company
The prototype of a connected desalinator for marinas: we designed its electronic board, wrote its embedded firmware, built the server that receives the measurements and developed the online monitoring, all the way to the showcase website.
The project at a glance
- Client
- UDM Company
- Sector
- Desalination and boating
- Platforms
- Web
- Our role
- Electronics design, firmware, server, monitoring web app and showcase website
The need
What the client needed
UDM Company designs desalination units for marinas: seawater is desalinated on site to wash and rinse boats, without drawing on the drinking water network. For now, the project is at the prototype stage: it works, and commercial launch is still to come.
A machine standing on a quay has to be monitored remotely: whether it is running, at what pressure, how much water it produces and when its filters need changing. There is no Wi-Fi and no network cable on site. And when the unit is rented, desalinated water will be billed by the litre: the count has to stay accurate, even after the link drops.
That meant the whole chain: an electronic board that reads the machine's sensors, firmware that transmits over the cellular network, a server that receives and stores the measurements, a monitoring interface, and a website to present the offer.
Our role
What we did
Maxime, an engineer at Web App Art, took on the whole chain, from the printed circuit board to the browser. The electronics are done in-house: schematics and circuit boards in KiCad, then the firmware running on the board. On the server side, an MQTT broker receives the measurements, a time-series database stores them and an API serves them to the web app.
- Electronics design in KiCad: schematics, component selection and circuit board routing, in two board versions
- Sensor signal conditioning: protected 12 V inputs, pulse flow inputs, an analogue multiplexer and shift registers
- C++ firmware for the Arduino MKR NB 1500: sensor reading, NB-IoT transmission, automatic reconnection and a hardware watchdog
- A sending rate that adapts to the machine's state
- The server: MQTT broker, PostgreSQL with TimescaleDB for time series, REST API
- A count of the water produced that withstands outages and duplicates
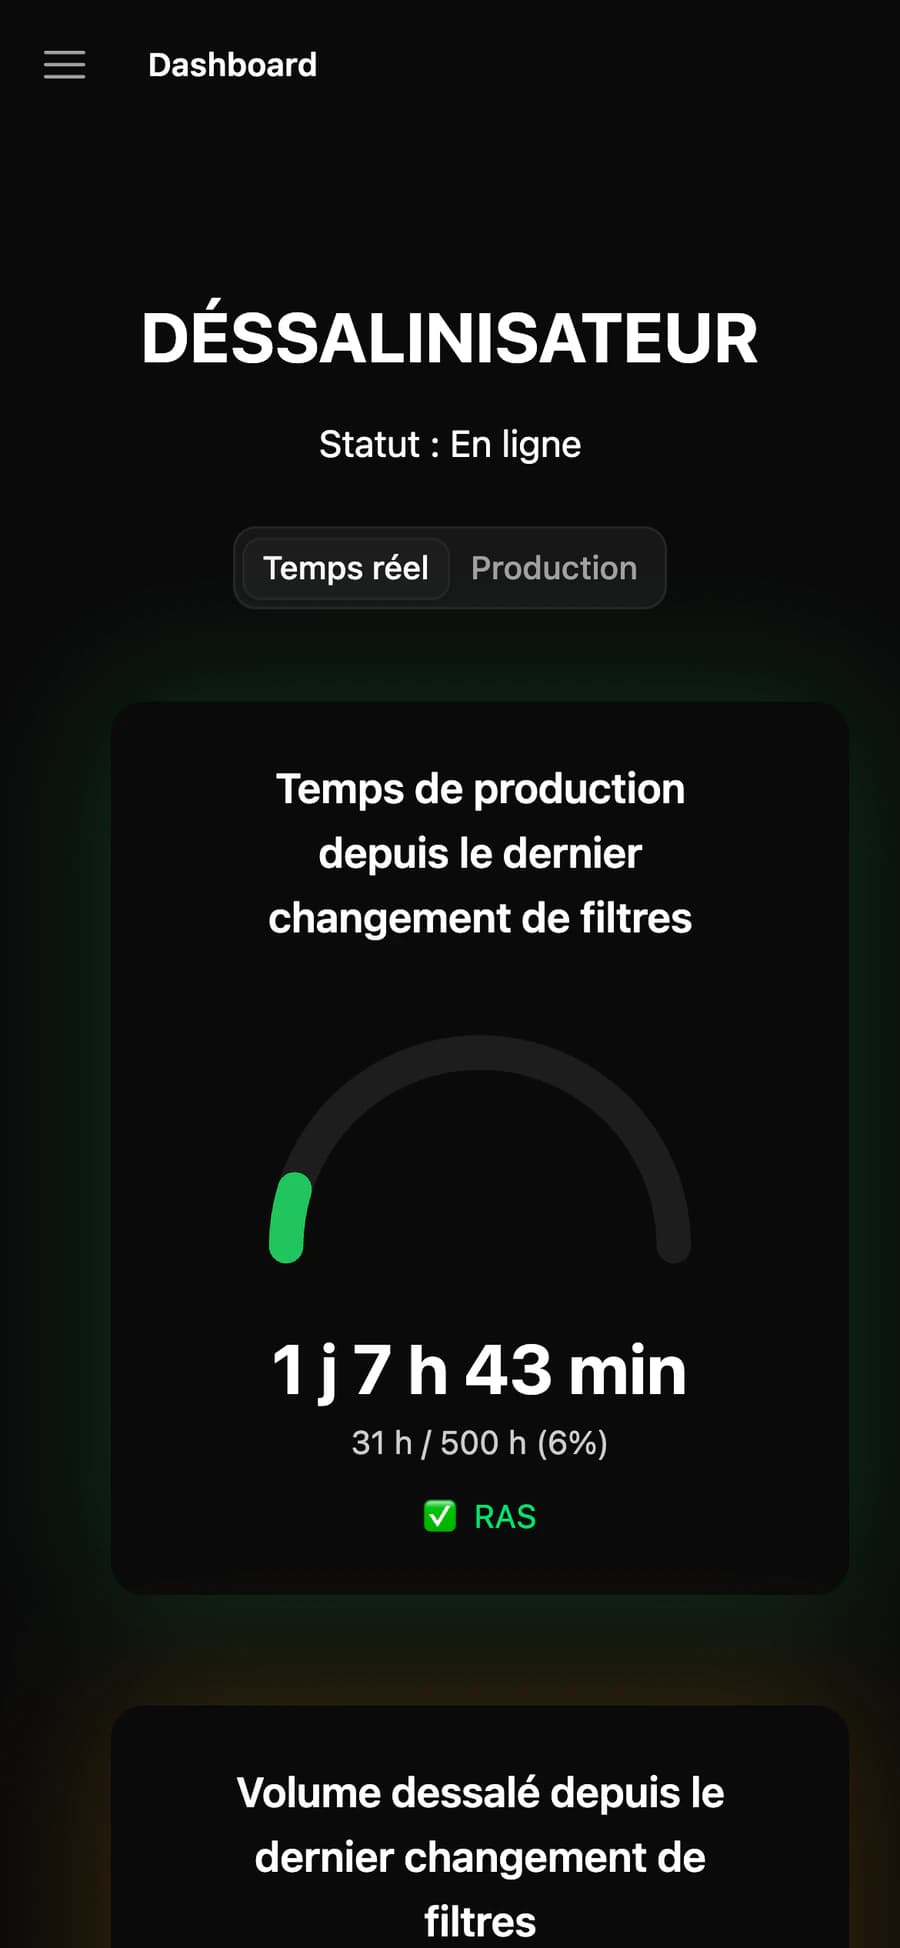
- The monitoring web app: real time, production by day and by month, filter tracking
- The udm-company.fr showcase website
Features
Key features
An electronic board designed in-house
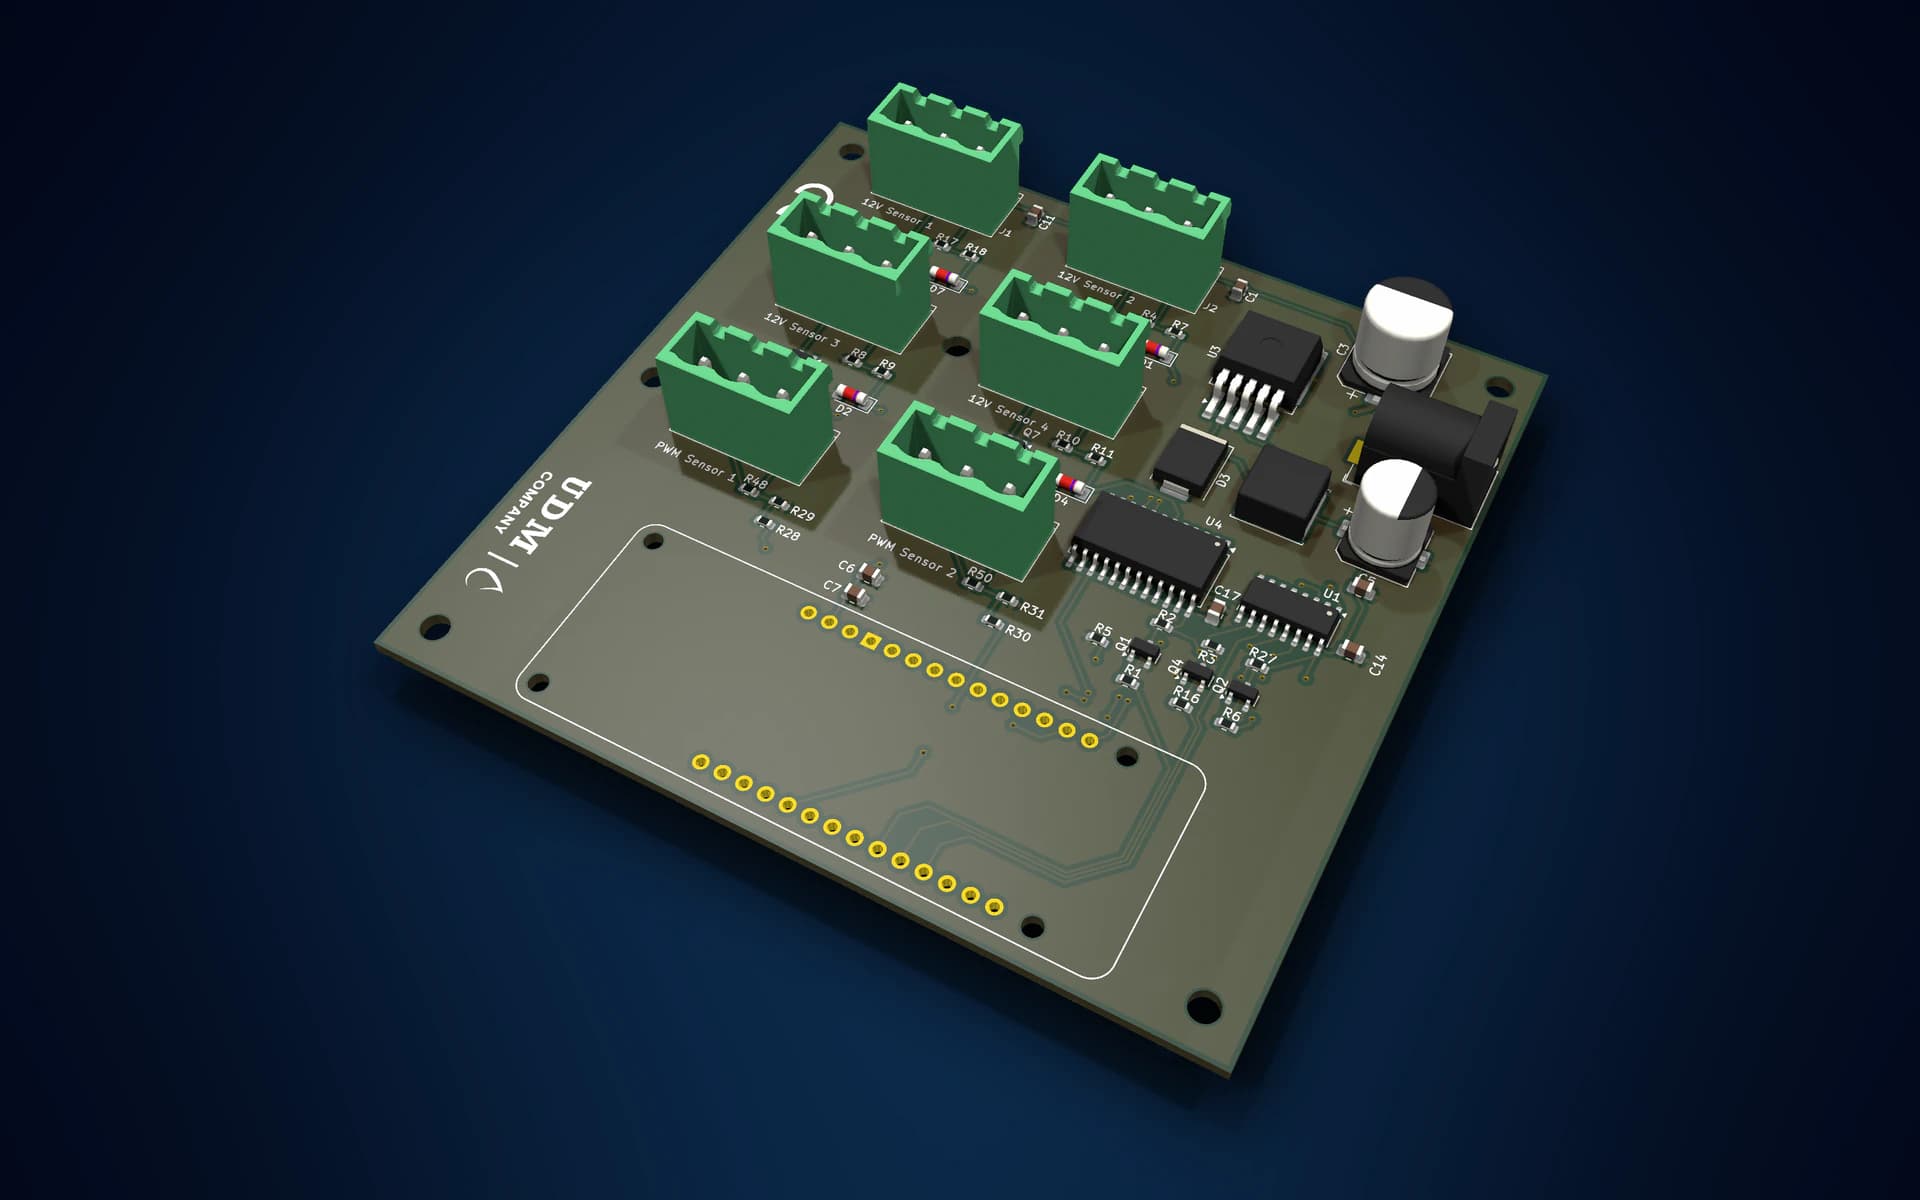
Schematics and circuit boards drawn in KiCad around an Arduino MKR NB 1500: 12 V to 5 V power supply, sensor inputs protected by Zener diodes, an analogue multiplexer and shift registers to drive everything with few pins.
Two versions of the board
A first, complete board, with sixteen 12 V sensor inputs, two relays and an on/off button. Then a more compact version, focused on measurement: four 12 V sensor inputs and two flow inputs.
Connected over the cellular network
The board transmits over NB-IoT, the cellular network for connected devices: no Wi-Fi and no cable to run along the quay. Measurements are sent over MQTT, a lightweight protocol built for this kind of link.
Firmware that does not get stuck
Automatic reconnection at increasing intervals, a modem restart when the link stops responding, and a hardware watchdog: if the program freezes, the board restarts on its own.
A sending rate that adapts
One reading per second at start-up or when values change, one every ten seconds in steady operation, a simple sign of life when stopped: enough detail without saturating the link.
No litre counted twice
The board sends the water produced as numbered increments, which build up during an outage. The server discards duplicates and late messages, and on restart the board resumes its numbering where the server left off.
Spurious readings filtered out
A flow reading while the inlet pressure is zero, with the pumps stopped, is electrical noise, not water: the server neutralises it on arrival, while keeping the pressure that records the stop.
Real-time monitoring
Inlet pressure and pressure before the membranes, inlet and outlet flow, online status: the web app receives the measurements live, over MQTT on WebSocket.
Production and filter wear
Production for the day, the last thirty days and each month, with running time. Gauges warn when the filters approach their hours or volume limit, and every change is logged.
Screens
The project on screen
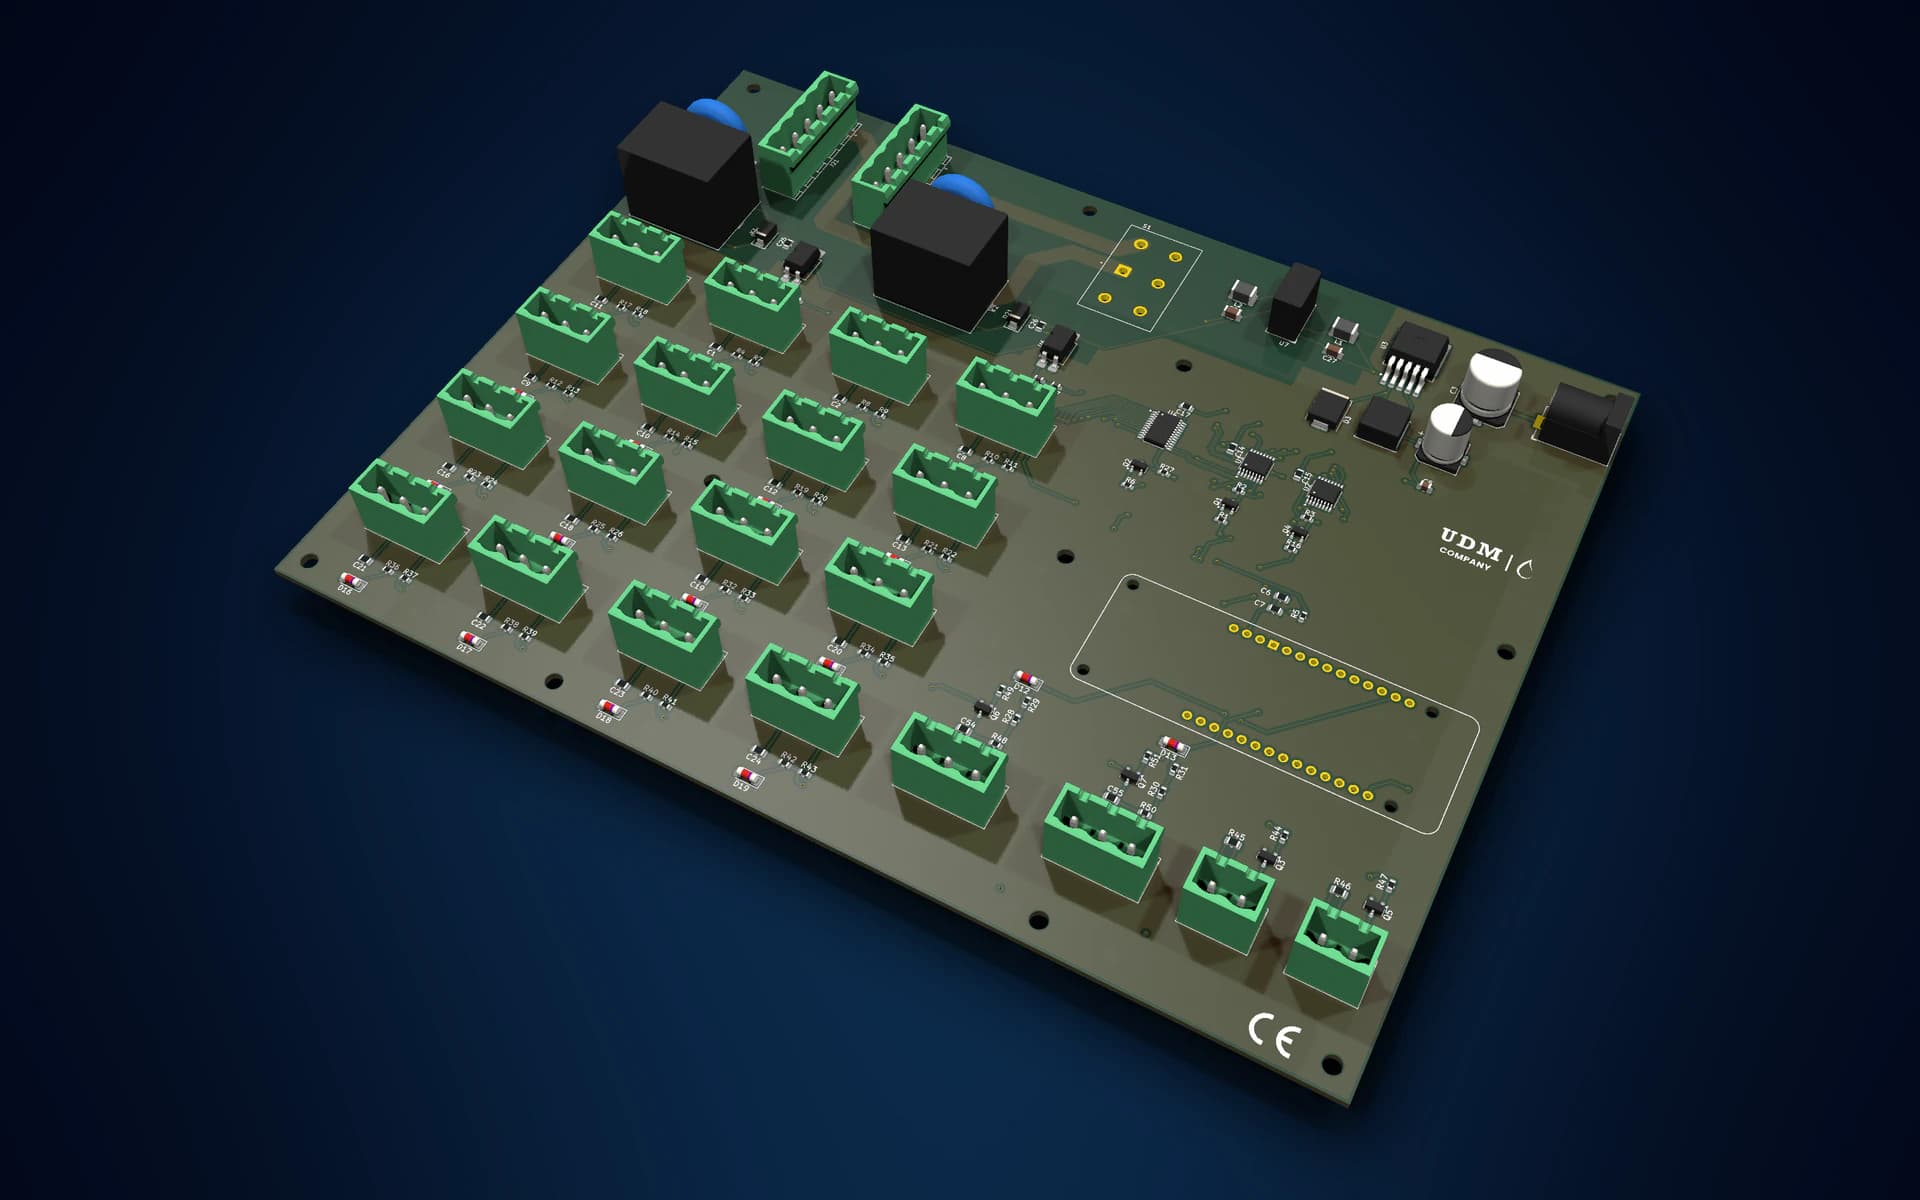
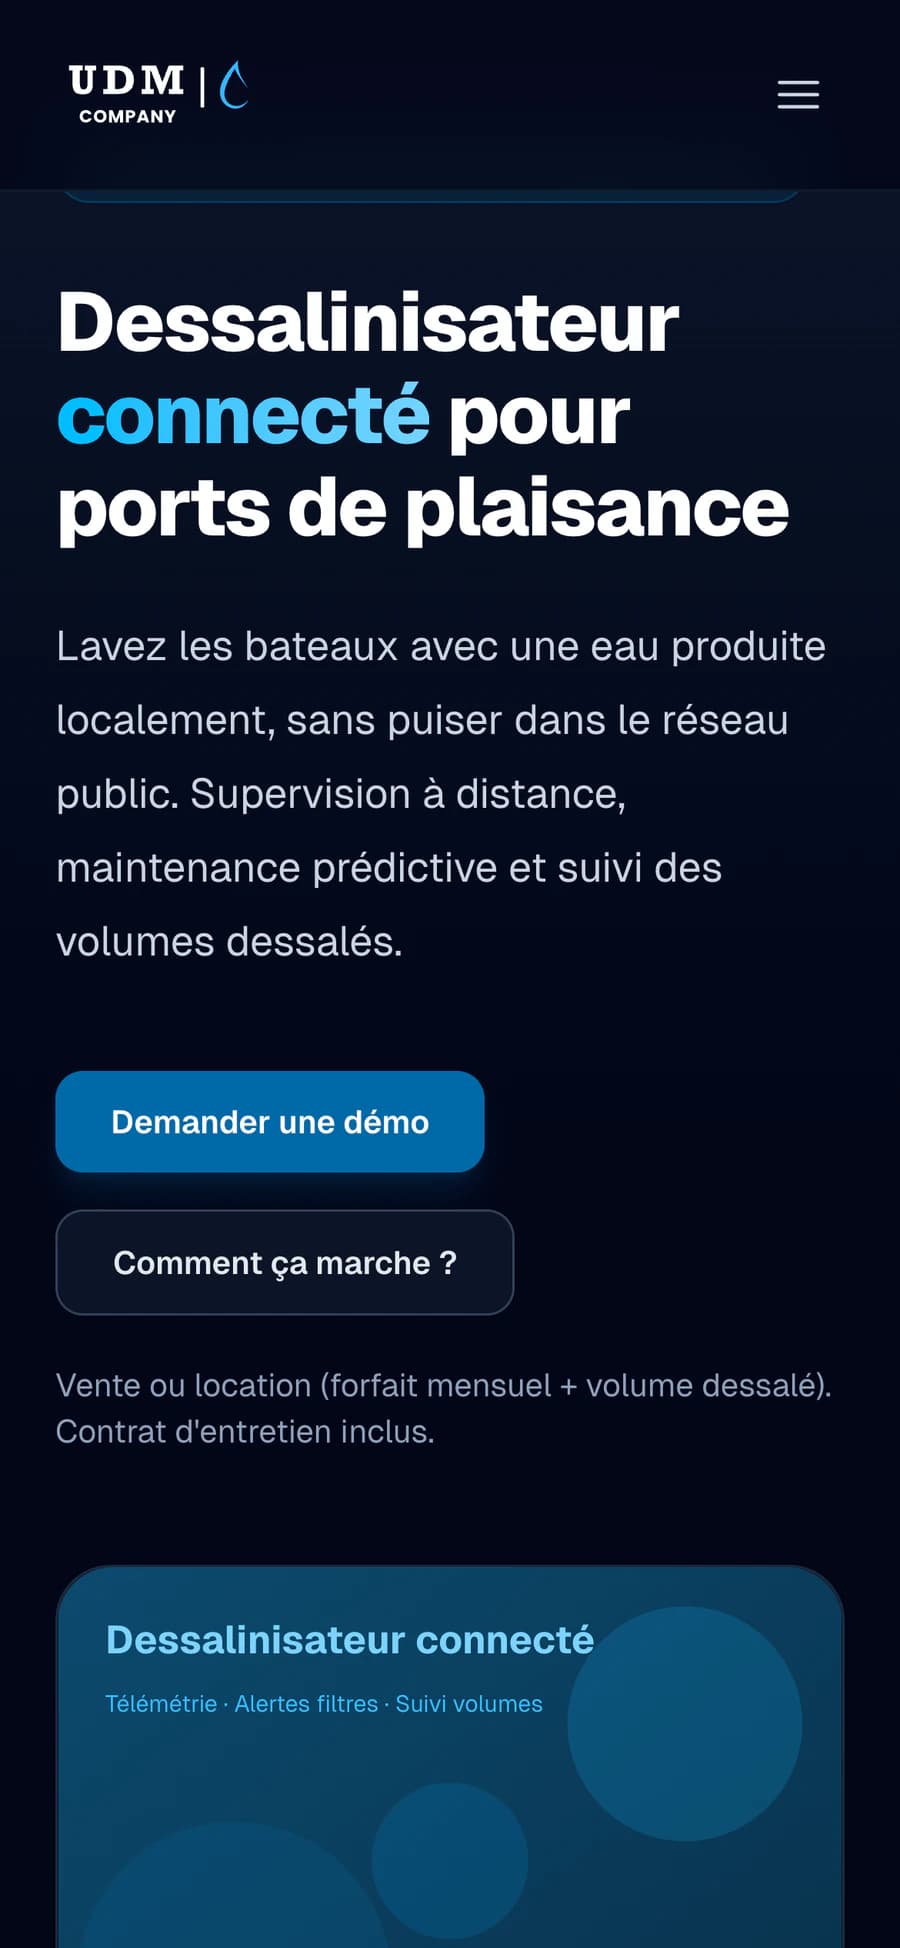
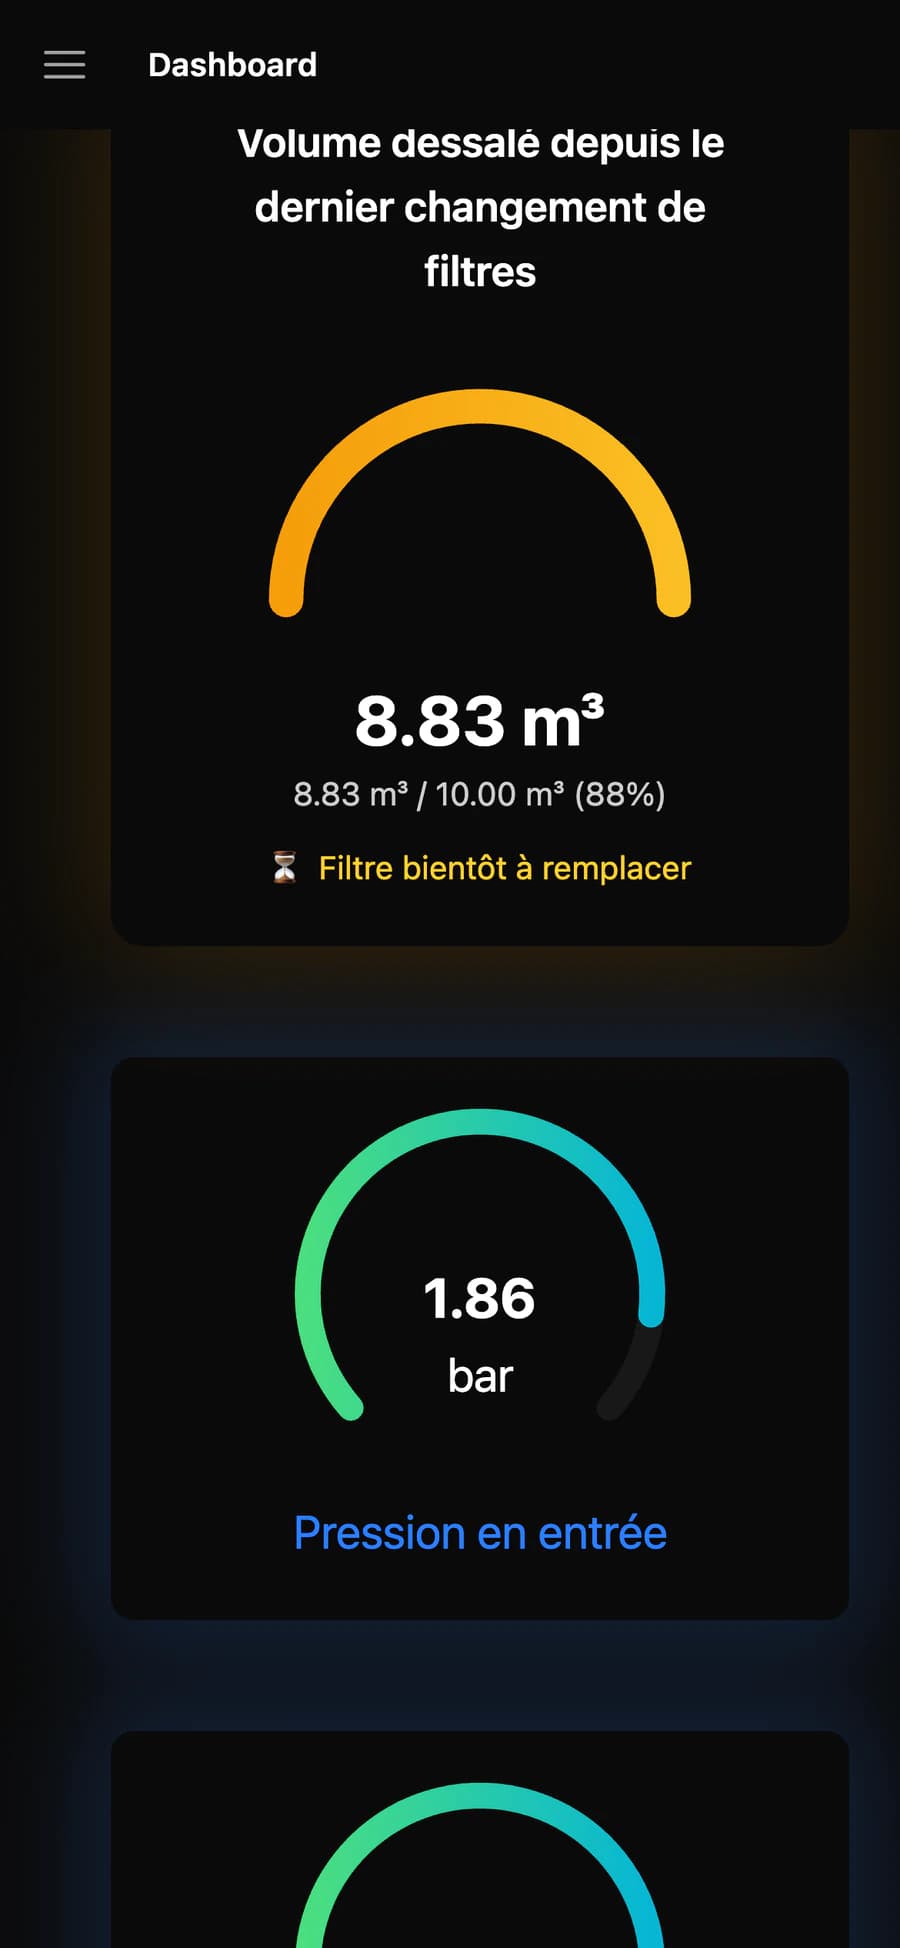
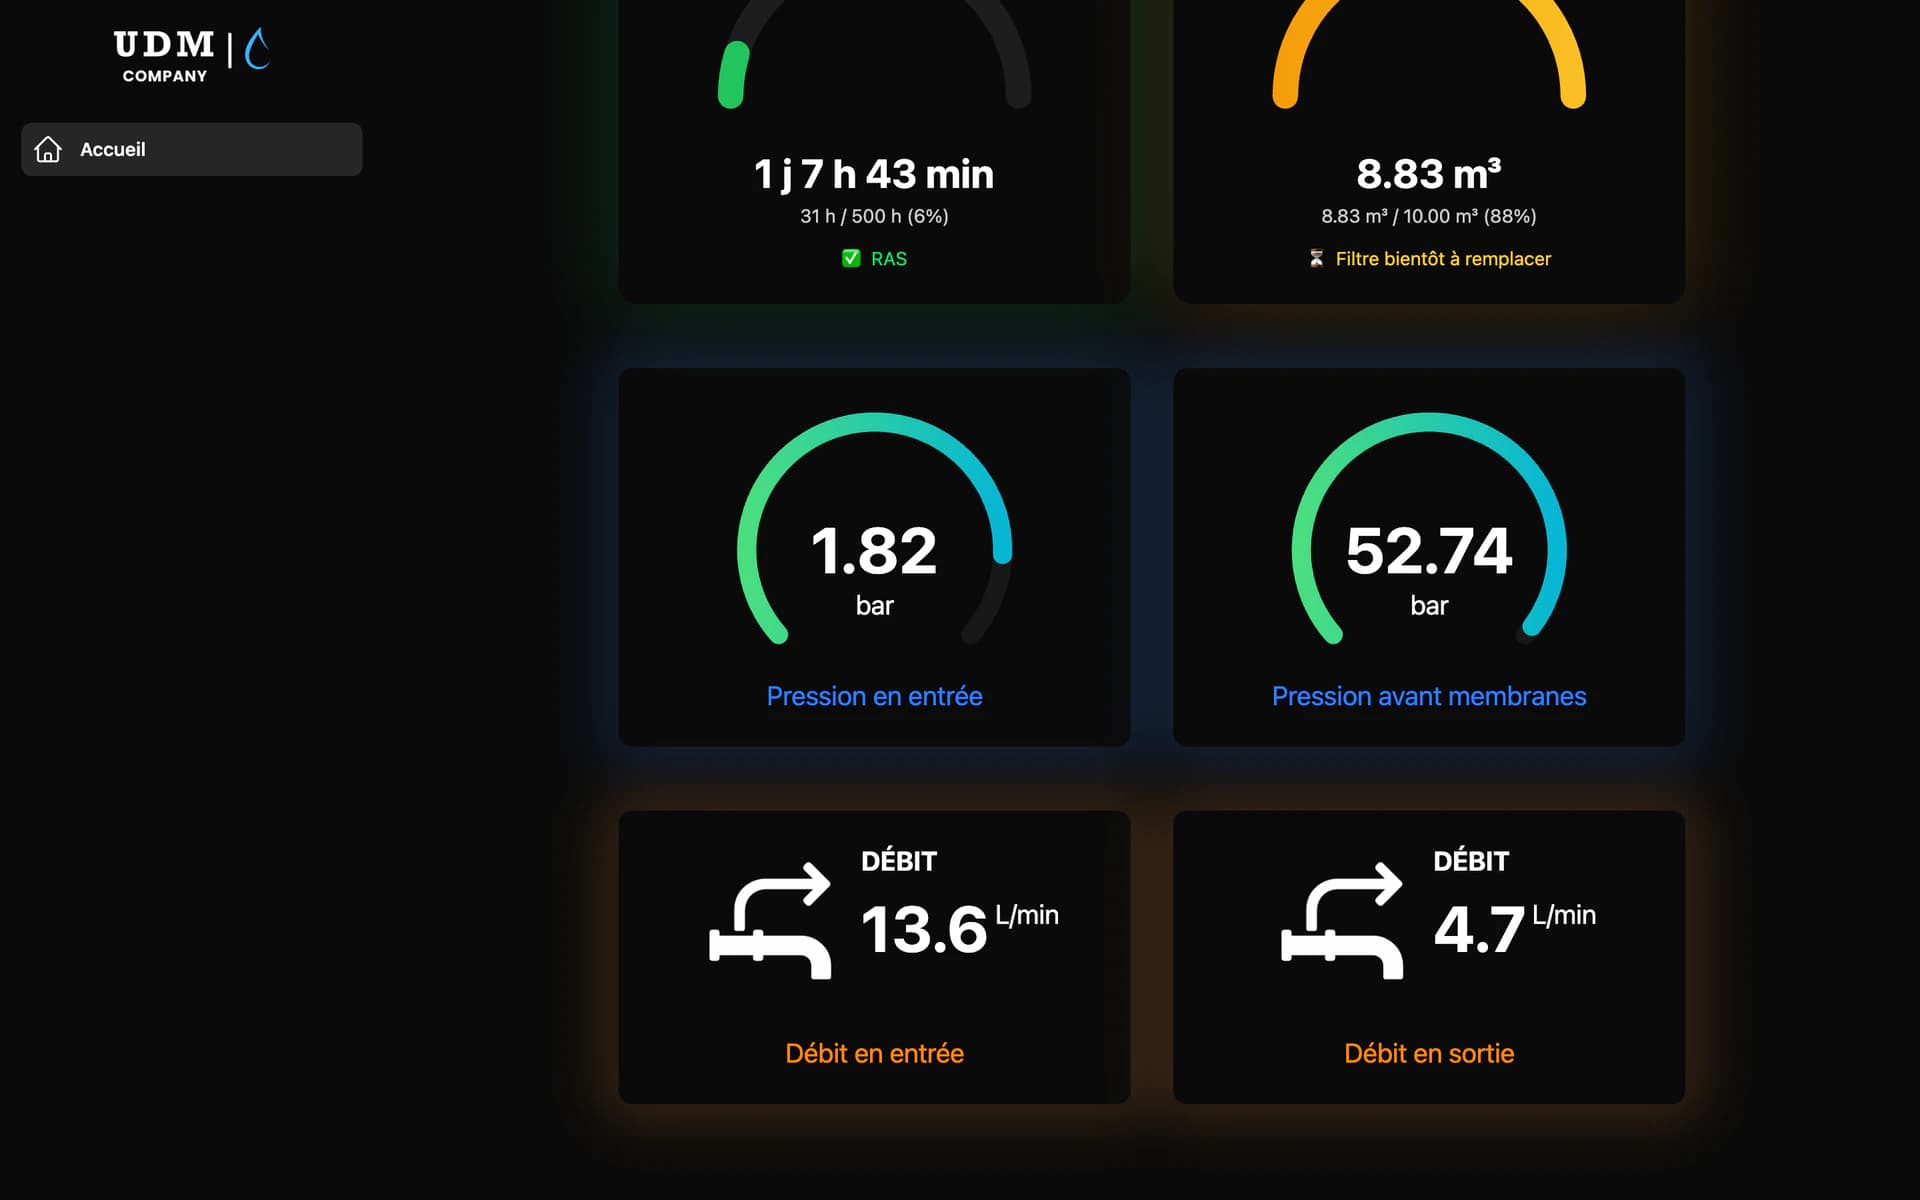
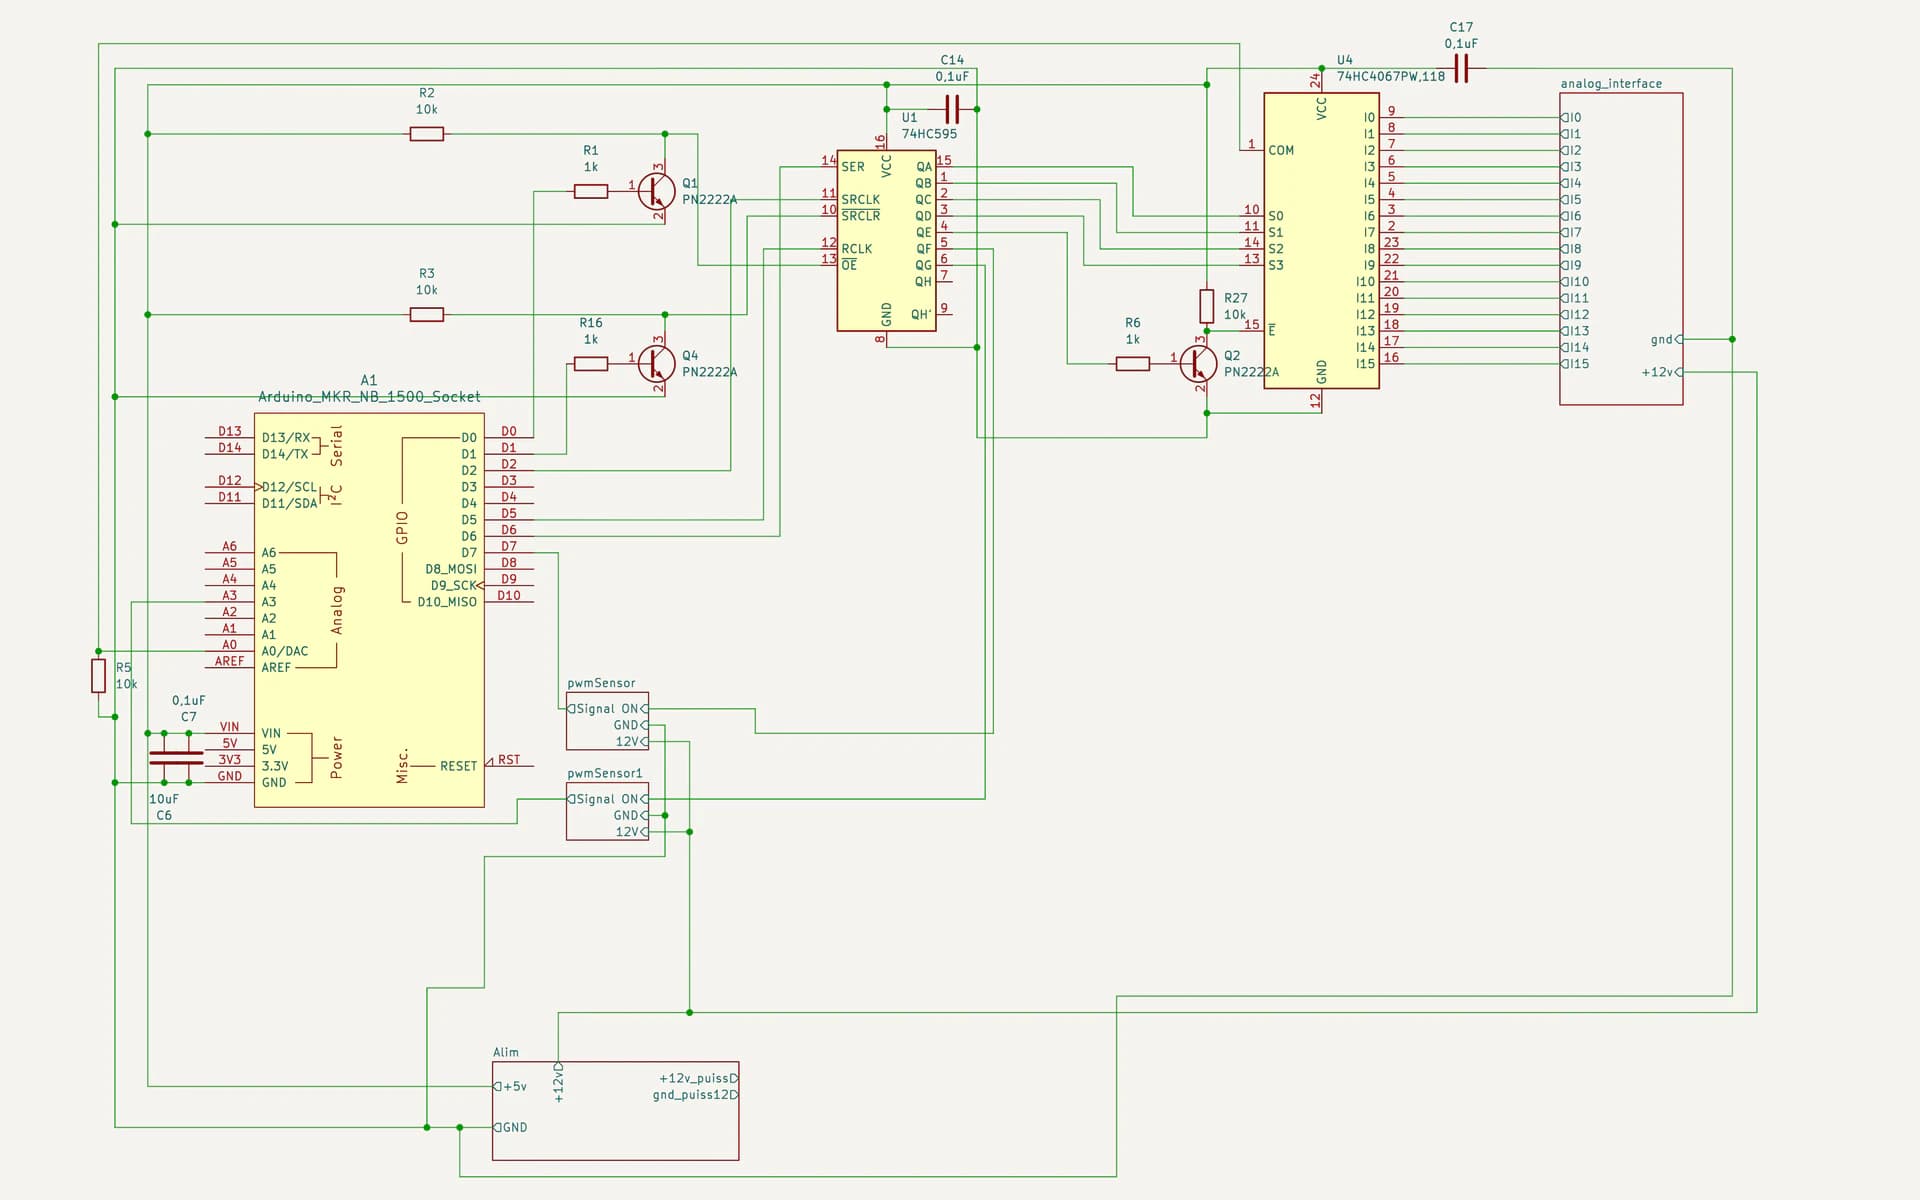
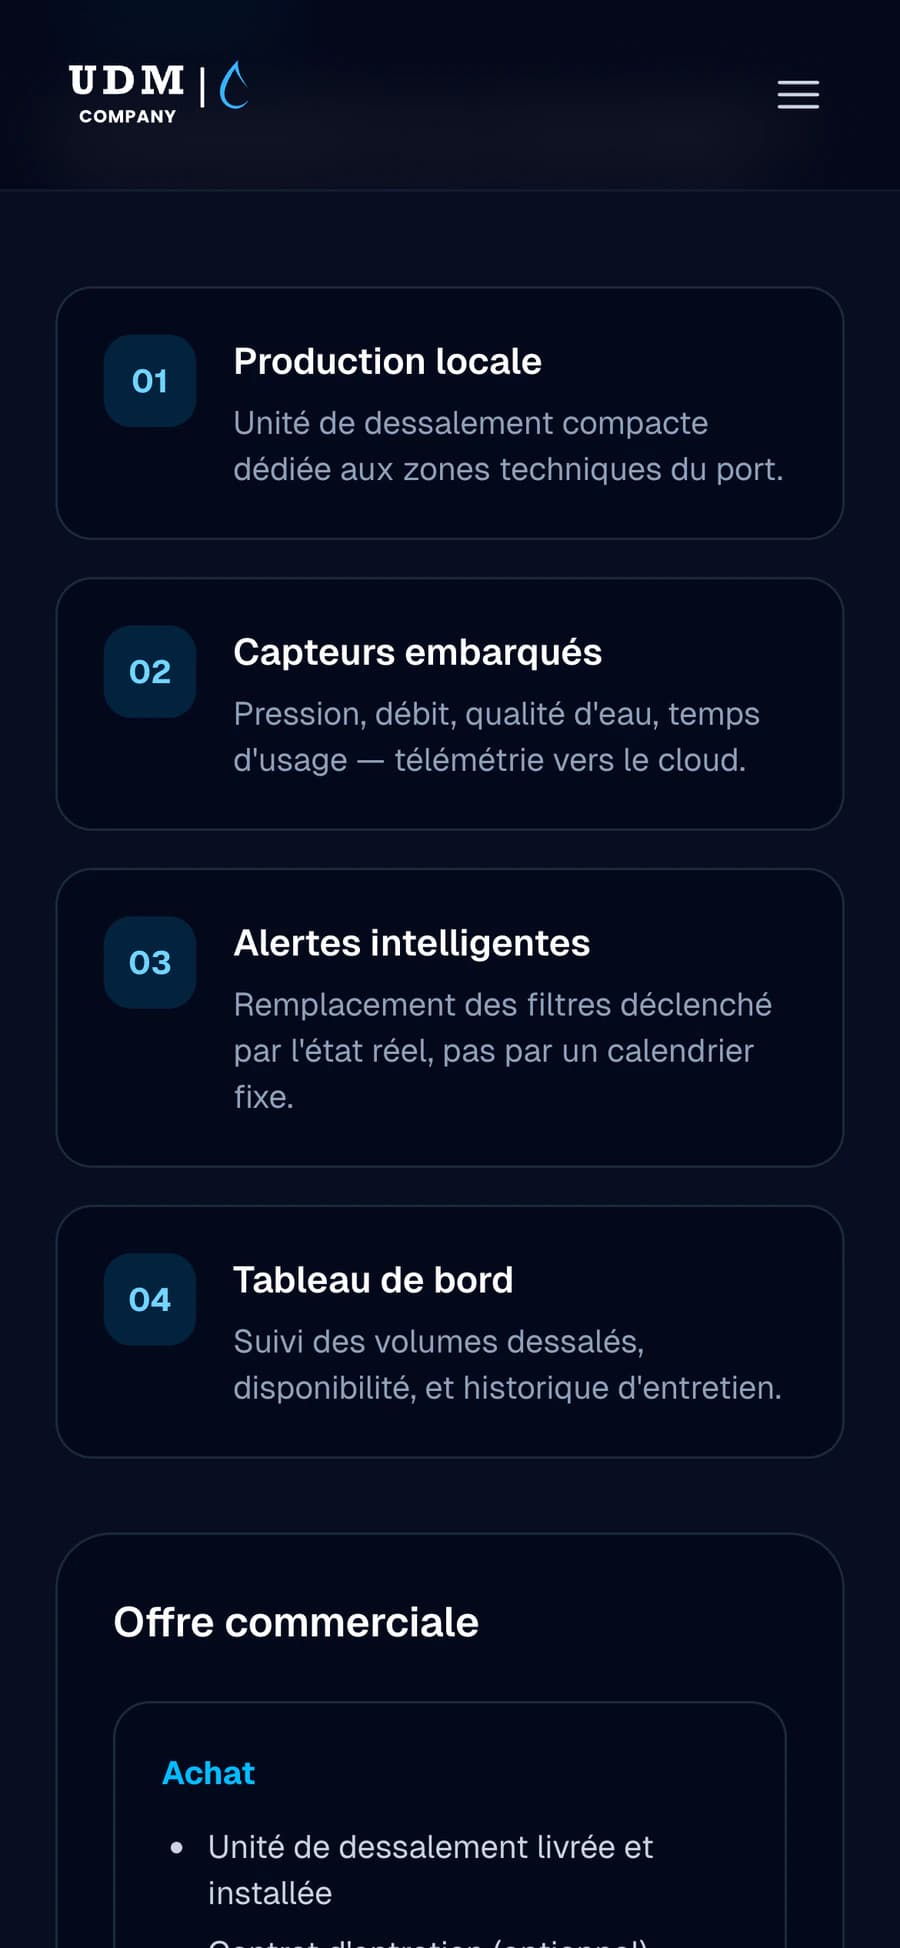
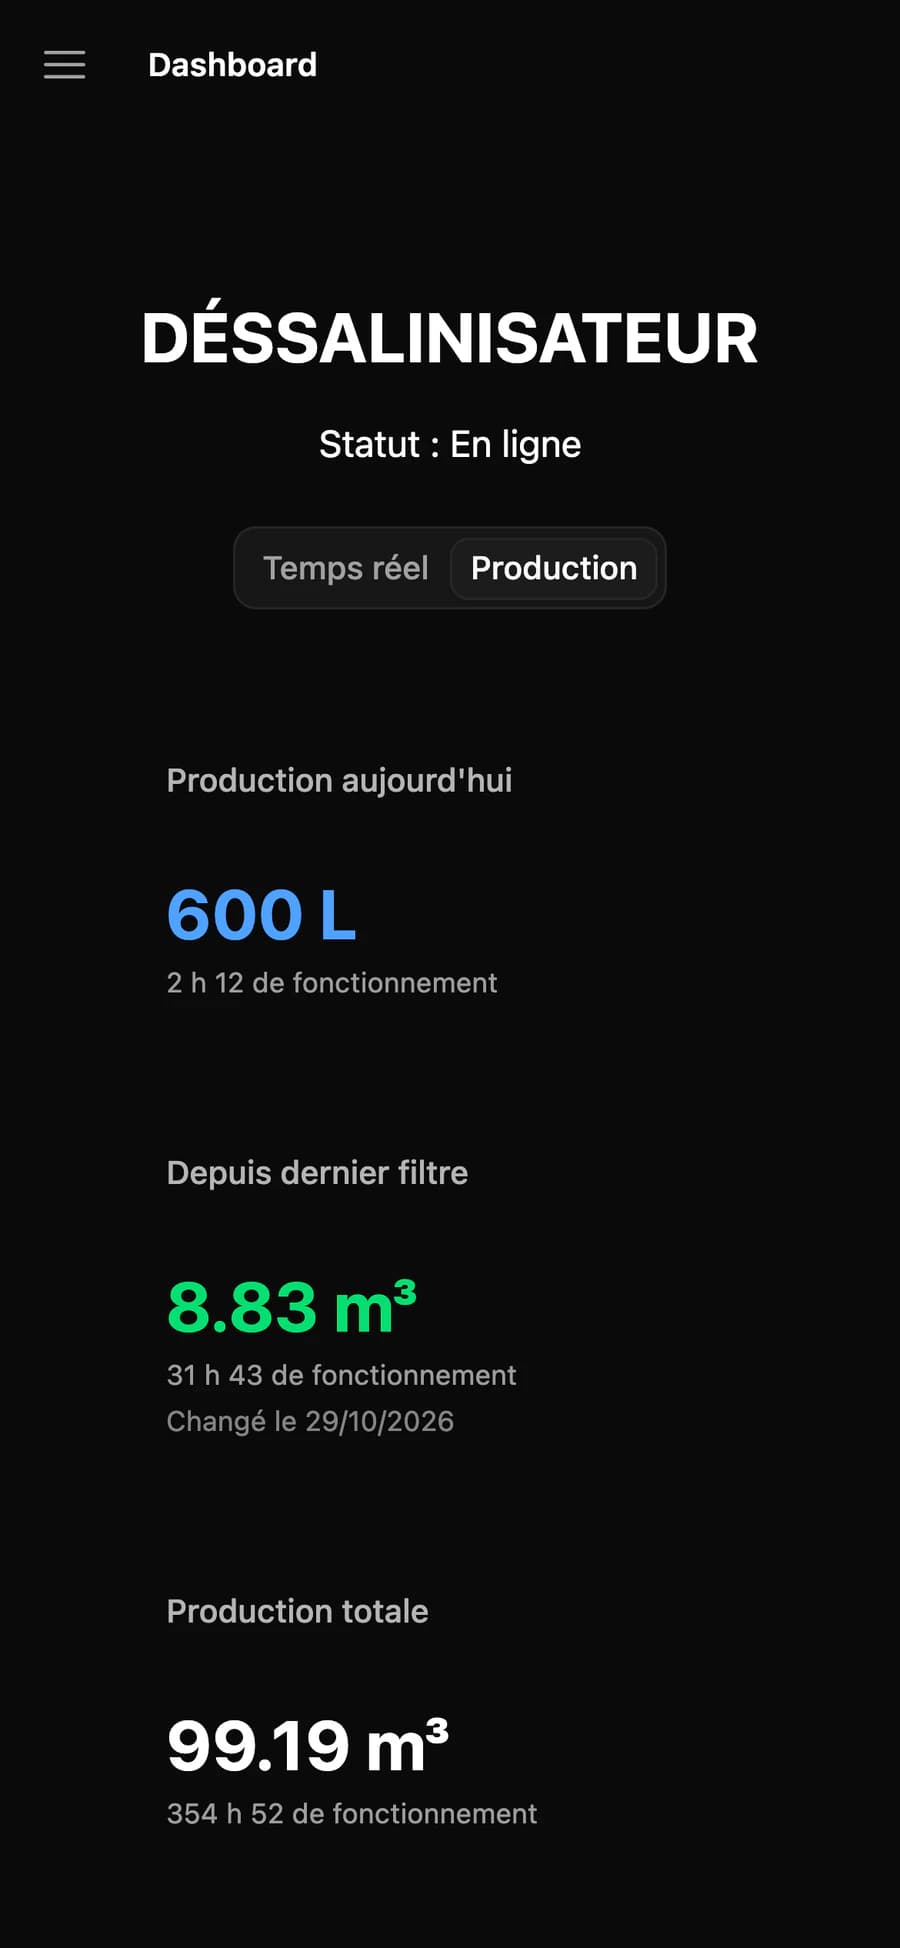
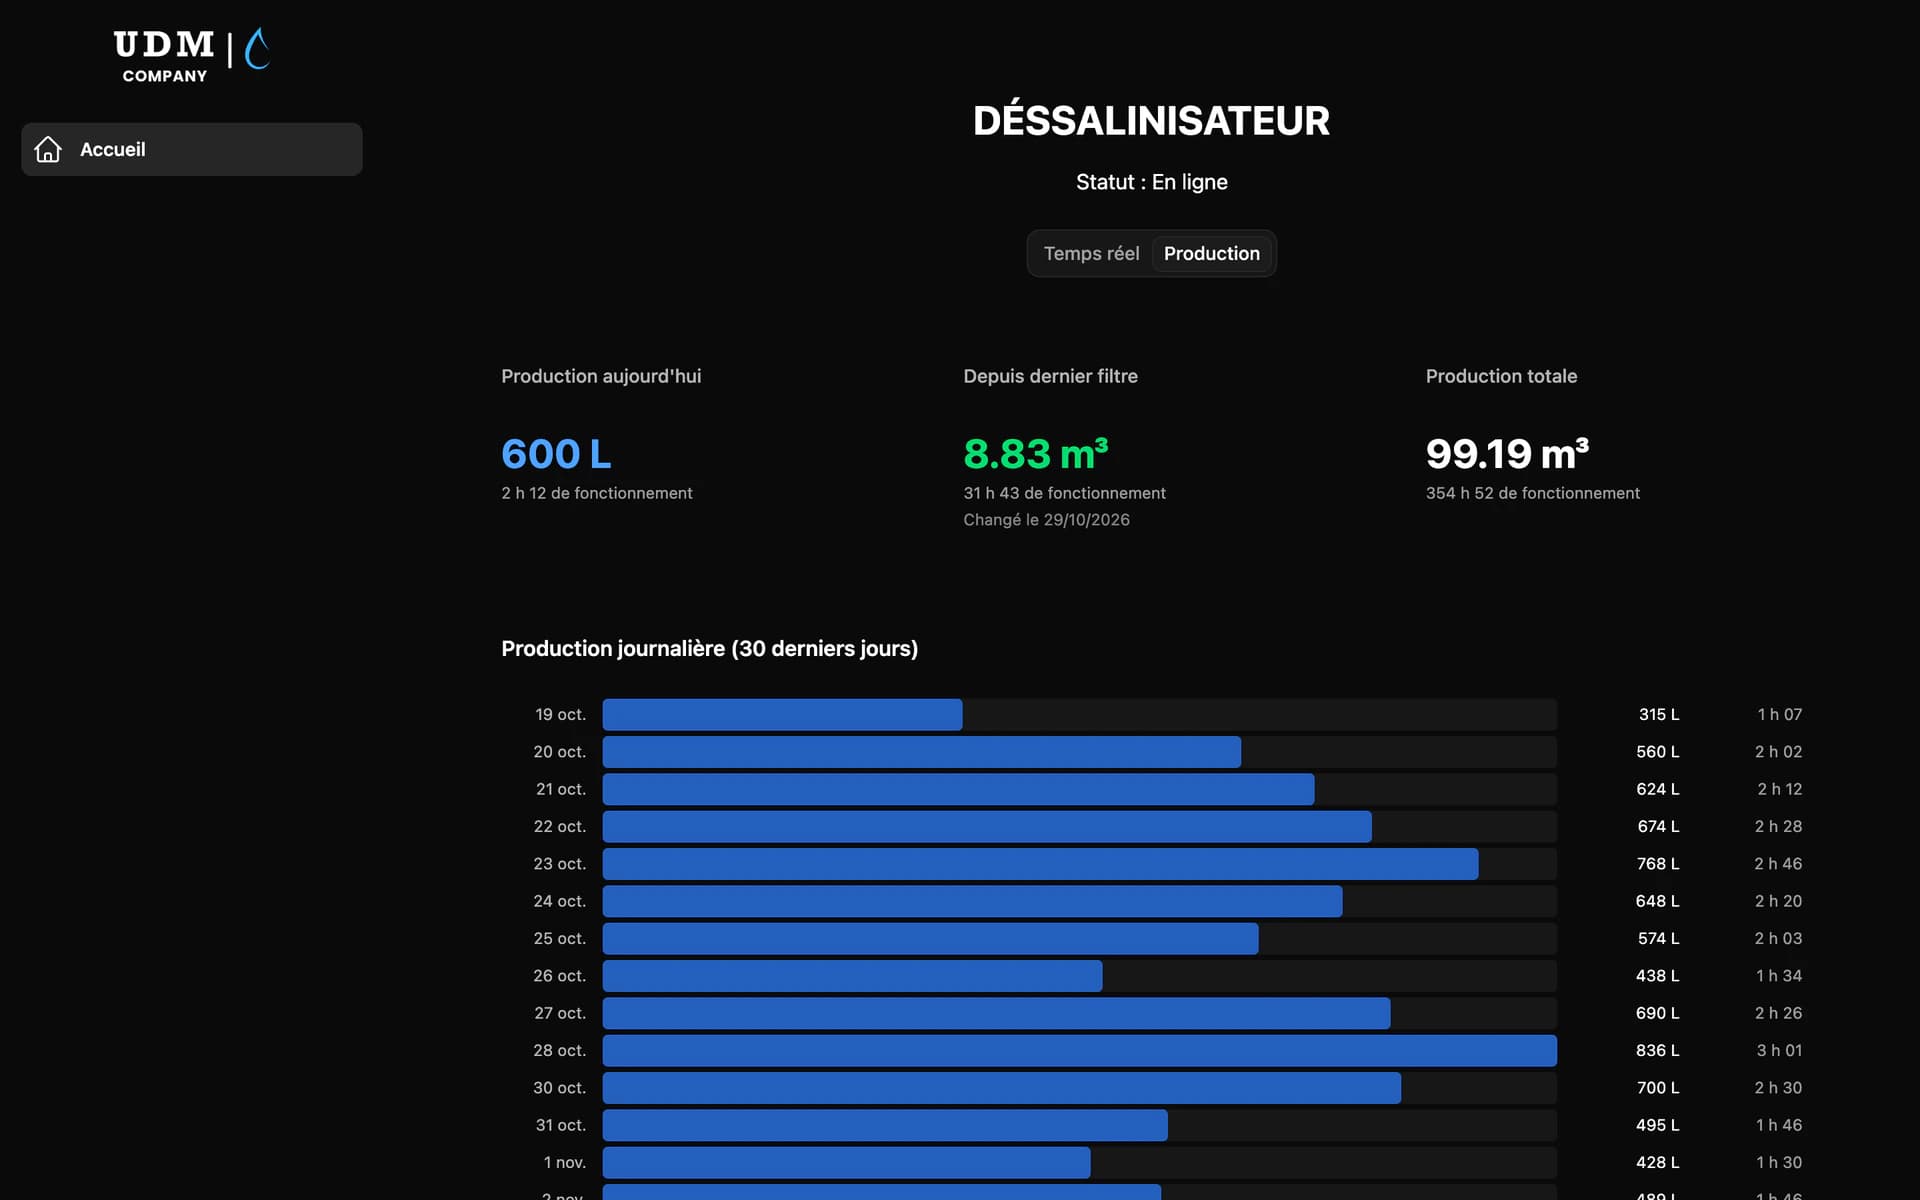
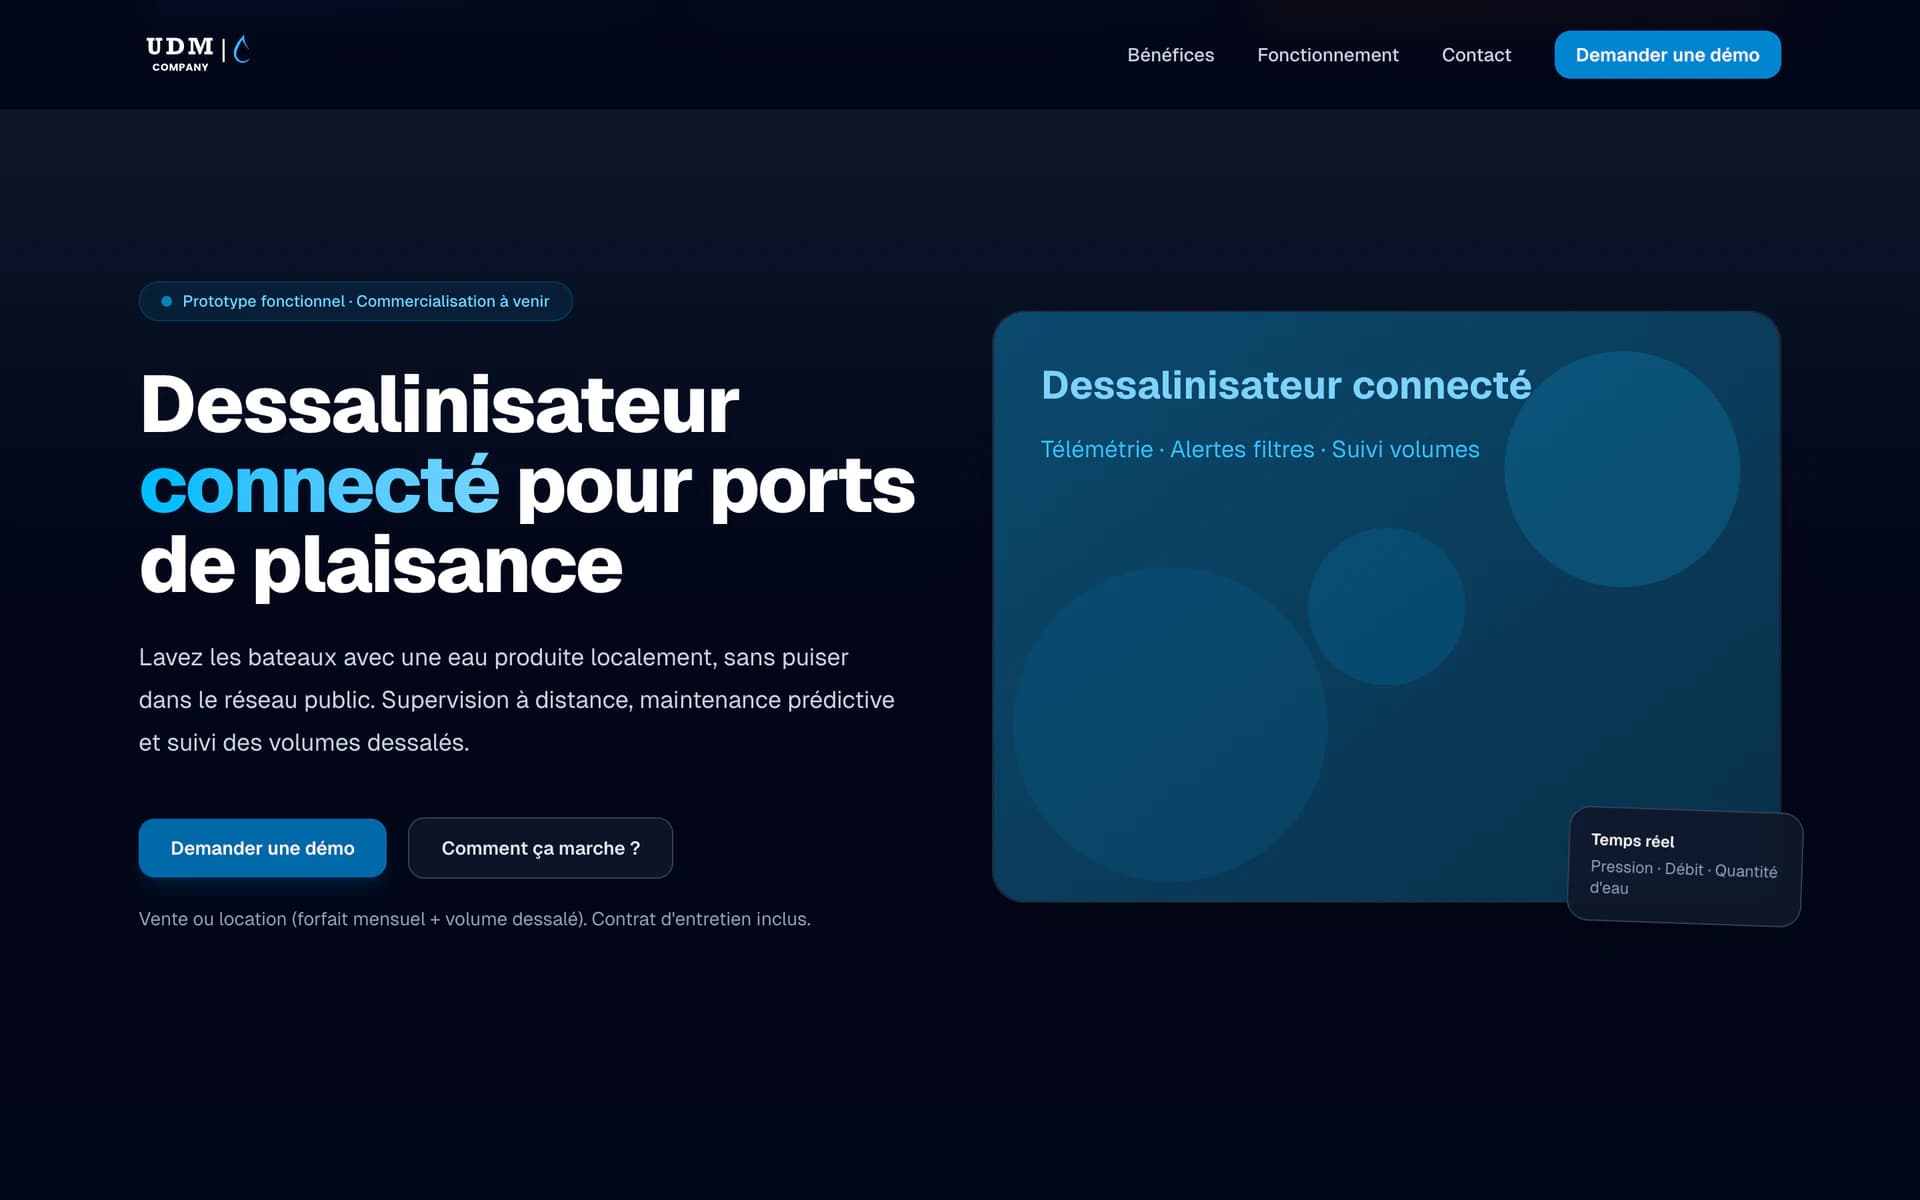
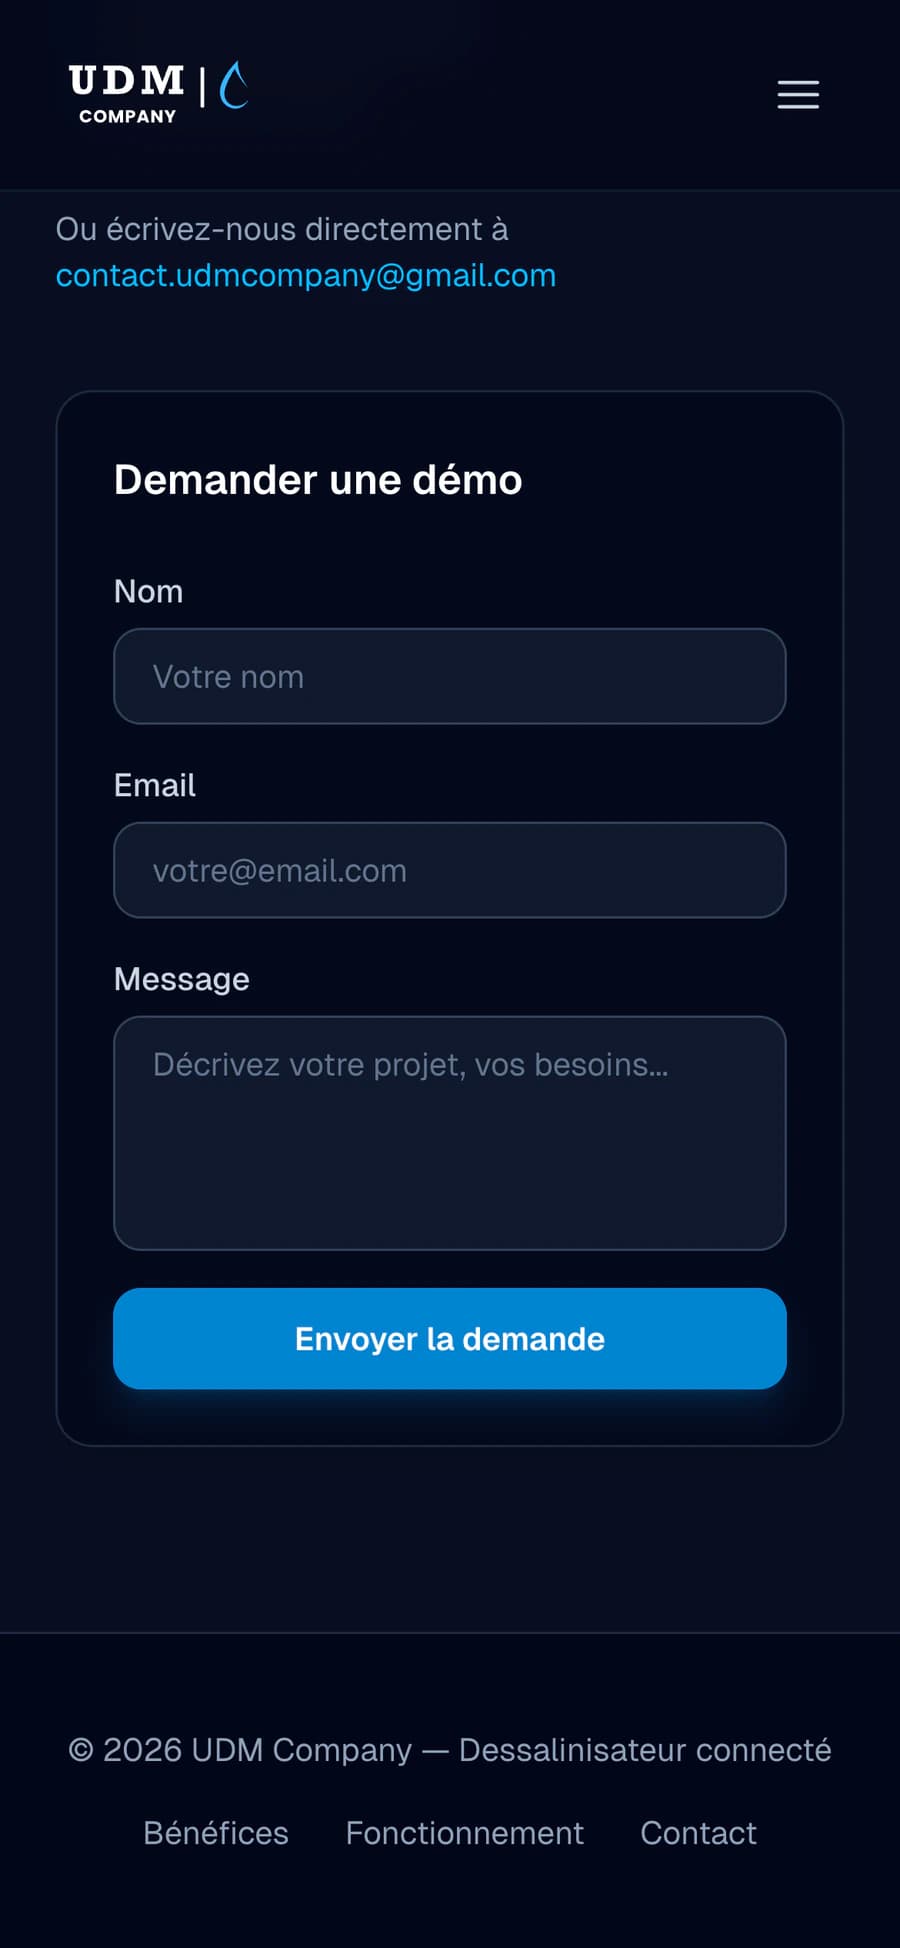
The 3D renders and the schematic are produced by KiCad from the design files. The udm-company.fr pages are screenshots of the live site. The web app screens were taken on a local installation, with fictitious data: invented measurements, volumes and dates.
Technologies
Technologies used
- KiCad
- C++
- Arduino MKR NB 1500
- NB-IoT
- MQTT
- Node.js
- Express
- PostgreSQL
- TimescaleDB
- Next.js
- React
- TypeScript
- Tailwind CSS
- nginx
Have an app project?
Tell us what you need: we will get back to you to set up a first meeting, with no commitment.